
Page 38 - AER_2022_BLINDER_FLIP
P. 38
36 Datos 2022
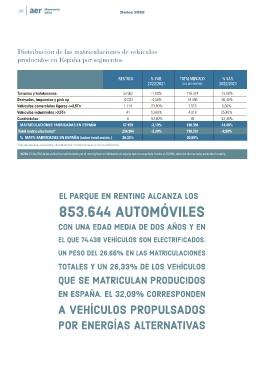
Distribución de las matriculaciones de vehículos
producidos en España por segmentos
RENTING % VAR. TOTAL MERCADO % VAR.
2022/2021 (EXCLUIDO RENTING) 2022/2021
Turismos y todoterrenos 53.962 -1,00% 118.324 -13,00%
Derivados, furgonetas y pick up 12.022 -4,00% 18.496 -30,40%
Vehículos comerciales ligeros <=3,5Tn 1.119 -23,90% 7.525 0,80%
Vehículos industriales >3,5Tn 41 10,80% 4.019 25,40%
Cuadriciclos 6 -53,80% 30 -42,30%
MATRICULACIONES FABRICADAS EN ESPAÑA 67.150 -2,10% 148.394 -14,40%
Total matriculaciones* 254.984 -2,30% 710.731 -8,90%
% MATR. FABRICADAS EN ESPAÑA (sobre total matric.) 26,33% 20,88%
*(sin autobuses, autocares, ciclomotores ni motocicletas y con cuadriciclos)
NOTA: El 26,33% de los vehículos matriculados por el renting fueron fabricados en alguna factoría española, frente al 20,88%, del total de mercado, excluido el renting.
EL PARQUE EN RENTING ALCANZA LOS
853.644 AUTOMÓVILES
CON UNA EDAD MEDIA DE DOS AÑOS Y EN
EL QUE 74.438 VEHÍCULOS SON ELECTRIFICADOS.
UN PESO DEL 26,66% EN LAS MATRICULACIONES
TOTALES Y UN 26,33% DE LOS VEHÍCULOS
QUE SE MATRICULAN PRODUCIDOS
EN ESPAÑA. EL 32,09% CORRESPONDEN
A VEHÍCULOS PROPULSADOS
POR ENERGÍAS ALTERNATIVAS