
Page 72 - AER_2018
P. 72
DATOS COMUNIDADES
EXTREMADURA
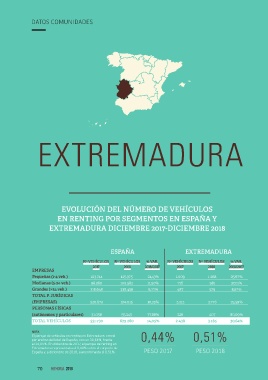
EVOLUCIÓN DEL NÚMERO DE VEHÍCULOS
EN RENTING POR SEGMENTOS EN ESPAÑA Y
EXTREMADURA DICIEMBRE 2017-DICIEMBRE 2018
ESPAÑA EXTREMADURA
Nº VEHÍCULOS Nº VEHÍCULOS % VAR. Nº VEHÍCULOS Nº VEHÍCULOS % VAR.
2017 2018 2018/2017 2017 2018 2018/2017
EMPRESAS
Pequeñas (1-4 veh.) 103.744 125.975 21,43% 1.009 1.268 25,67%
Medianas (5-24 veh.) 98.280 109.582 11,50% 716 981 37,01%
Grandes (>24 veh.) 318.648 338.458 6,22% 487 529 8,62%
TOTAL P. JURÍDICAS
(EMPRESAS) 520.672 574.015 10,25% 2.212 2.778 25,59%
PERSONAS FÍSICAS
(autónomos y particulares) 31.058 55.245 77,88% 226 407 80,09%
TOTAL VEHÍCULOS 551.730 629.260 14,05% 2.438 3.185 30,64%
NOTA
El parque de vehículos en renting en Extremdura creció 0,44% 0,51%
por encima del total de España, con un 30,64%, frente
al 14,05%. En diciembre de 2017, el parque de renting en
Extremadura representaba el 0,44% sobre el conjunto de
España y, a diciembre de 2018, aumentó hasta el 0,51%. PESO 2017 PESO 2018
70 MEMORIA 2018